Post-Raya Factory Shutdown: How SME Owners Can Use Real Production Data and TNB Maximum Demand Records to Recheck Their Solar ATAP Sizing in Malaysia
This is the perfect moment to ask a strategic question: is your existing (or planned) Solar ATAP system sized based on real production and Maximum Demand behaviour—or did someone just aim for 100% MD on paper and hope for the best?
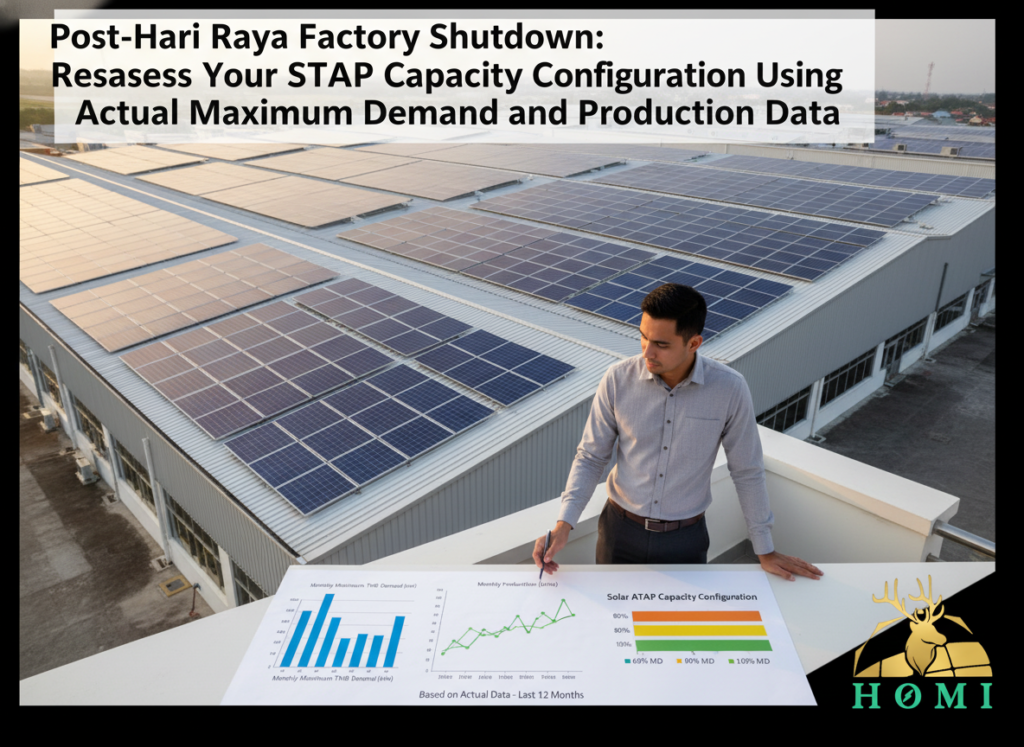
Under Solar ATAP, commercial and industrial users can size their PV systems up to 100% of Maximum Demand (MD), capped at 1 MW per account, but export credits still follow a self-consumption logic and do not roll over. If you ignore the actual operating hours of your lines, weekend shutdowns and seasonal patterns like Raya, you risk oversizing and wasting valuable generation. This article shows how to use 12 months of MD data, TOU profiles and real production numbers to recheck your Solar ATAP sizing—and how HOMI combines this with GITA to build a smarter investment case.
1. Quick Refresher: MD, TOU and the 100% Solar ATAP Limit
For medium-voltage commercial and industrial customers, TNB charges not only for energy (kWh) but also for Maximum Demand, measured in kW as the highest 30-minute average during the billing month. Under Solar ATAP, the inverter output capacity for non-domestic consumers can go up to 100% of this MD (based on the average recorded MD of the past 12 months), subject to a 1 MW cap and technical checks.
| Parameter | What It Means |
|---|---|
| Maximum Demand (MD) | Highest 30-minute average kW in a month—often set by your peak production + HVAC loads. |
| Time-of-Use (TOU) | Peak vs off-peak windows (e.g. 2pm–10pm peak) where both energy and MD cost impacts differ. |
| Solar ATAP Capacity Limit | Up to 100% of average MD over 12 months, capped at 1 MW per TNB account, subject to technical assessment. |
100% MD is a ceiling, not a recommendation. A “100% MD” PV system that generates most of its output when your factory is idle can look impressive on paper but weak on ROI under Solar ATAP’s monthly credit rules.
2. Step 1 – Compare Pre-Raya and Post-Raya Production vs MD
Start with your own data. Most SME and factory owners already track production output by shift; TNB billing shows MD by month, and many plants have MD or load-logging systems.
Practical checks to run:
- List your last 12 months of MD (kW) from TNB bills or your MD logger.
- Mark months with special events: pre-Raya ramp-up, Raya shutdown, post-Raya restart, major maintenance.
- Overlay your monthly production or utilisation percentage on the same timeline.
- Does MD move broadly in line with production volume, or is it driven by a few short spikes?
- Are there months where MD stays high even though production is lower (e.g. due to inefficient scheduling)?
- How different are “normal” months from months with long shutdowns like Raya?
3. Step 2 – Map MD and Solar Output Against Operating Hours and Weekends
Solar ATAP generation peaks in the late morning to mid-afternoon. The question for a factory is: how much of that window overlaps with real machine runtime?
Key questions to ask your team:
- What are your typical shift patterns on weekdays (e.g. 8am–5pm single shift, 24/7, 2-shift, 3-shift)?
- How often do you run overtime or special production on weekends/public holidays?
- During Raya shutdown, which loads stay on (chillers, security, basic lighting) and at what level?
If you see that a large share of MD and kWh occurs during 9am–6pm on working days, a larger Solar ATAP system may be justified. If MD is heavily concentrated in short evening peaks or weekend spikes while weekdays are modest, “100% MD” solar could overshoot your real daytime consumption.
Under Solar ATAP, weekday self-consumption during production hours is worth far more than weekend shutdown exports that may not fully translate into bill savings by month-end.
4. Step 3 – Recognise the Risk of Oversizing Under Solar ATAP’s Credit Rules
For non-domestic users, Solar ATAP credits offset energy costs but still follow a monthly accounting logic: self-consumption first, then export credits that offset the energy portion of your bill, with no long-term rollover.
- On working days, your system performs well—but on low-load days and weekends, export is very high.
- On long shutdowns (Raya, year-end), your plant is mostly off while your Solar ATAP system still generates near full capacity.
- Export credits in “light” months approach or exceed your energy charges, with limited additional benefit.
5. Simple MD + Production-Based Solar Sizing Scenario Calculator
Quick Scenario Check: 60% vs 80% vs 100% MD Solar ATAP
Use this very simple tool to visualise how different Solar ATAP sizes (as % of MD) might interact with your weekday vs weekend usage pattern.
Assumptions: Very simplified; assumes solar output peaks overlap with MD-based load percentages given, and that working days vs non-working days follow a typical pattern. Actual Solar ATAP crediting, TOU charges and MD behaviour must be modelled using real interval data.
6. Where GITA Fits In: Tax Incentives on Top of Data-Driven Sizing
2026 is one of the key years for commercial and industrial GITA (Green Investment Tax Allowance) claims on solar projects. GITA typically allows you to claim up to 100% of solar CAPEX as tax allowance, offsetting up to 70% of statutory income and effectively reducing your net project cost by your tax rate.
- A data-driven Solar ATAP size (e.g. 60–80% of MD) can still enjoy GITA on the full CAPEX of that system.
- A well-sized system with strong self-consumption can often beat a maxed-out 100% MD system in both payback and internal rate of return, even with the same GITA benefit.
- Because 2026 is a critical deadline for many GITA categories, aligning your “post-Raya sizing review” with a tax planning discussion is essential.
7. How HOMI Uses 12 Months of MD, TOU Profiles, Production Schedules and GITA to Build Options
HOMI’s role is to translate policy (100% MD, Solar ATAP, GITA) into plant-level decisions that match your real operations.
- Collecting 12–24 months of MD data and TOU interval consumption from TNB or your EMS, plus production records and shift schedules (including shutdown periods like Raya).
- Simulating several Solar ATAP capacity options—for example, 60%, 70%, 80% and 100% of MD—and calculating expected self-consumption vs export on weekdays, weekends and long shutdowns.
- Overlaying TNB’s current MD and TOU rates as well as Solar ATAP’s credit mechanism to estimate monthly savings, MD impact and payback.
- Integrating GITA and other incentives so you see net CAPEX after tax savings, not just gross project cost.
FAQ: Maximum Demand, Solar ATAP Sizing and GITA for Factories & SMEs
Why is sizing Solar ATAP to 100% of Maximum Demand sometimes a bad idea for factories?
Sizing to 100% of Maximum Demand is attractive because the guidelines allow it, but MD is a peak value based on the highest 30-minute interval and does not necessarily reflect your typical daytime energy use. If your plant has irregular peaks, limited weekend operations or long shutdowns, a 100% MD system may produce large amounts of energy when there is little load to consume it. Under Solar ATAP’s monthly credit rules, this excess export may not generate proportional financial benefits, which is why many factories achieve better ROI with a well-chosen fraction of MD rather than the maximum possible size.
How should we use production data and shift schedules when rechecking Solar ATAP sizing after Raya?
Production data and shift schedules show when your real loads are present, not just how big they can be at peak. By overlaying 12 months of MD and TOU data with production volumes, shift patterns and known shutdowns like Raya, you can identify how much of your typical 10am–4pm window is actually filled with meaningful load. This helps you size Solar ATAP so that its generation aligns with real consumption hours, minimising excess export on weekends and holidays and improving the value of each kilowatt of installed capacity.
How does GITA influence the decision between 60%, 80% and 100% MD Solar ATAP sizing?
GITA reduces the effective cost of your solar investment by allowing you to claim up to 100% of CAPEX as tax allowance, offsetting up to 70% of statutory income. This improves the payback for all viable system sizes, but it does not change the underlying fact that oversized systems may export more energy than your bill can absorb under Solar ATAP. In practice, a slightly smaller system with high self-consumption and good alignment to production hours can deliver a stronger post-tax return than a maximum-sized system that wastes generation, even though both enjoy GITA. The optimal choice balances technical fit, Solar ATAP credit behaviour and tax planning together.