Solar ATAP Malaysia Sizing Guide: 3 Simple Charts to Decide If Your TNB Bill and Usage Really Suit a Rooftop System
Under Solar ATAP, **export credits only offset the Energy Charge and expire every billing cycle with no rollover**, which makes precise sizing and daytime usage far more important than under NEM 3.0. [web:33][web:44][web:57] Instead of just asking “How many kW can fit on my roof?”, the smarter question is “Does my TNB bill and day/night pattern support a system that will actually pay off?” [web:33][web:259]
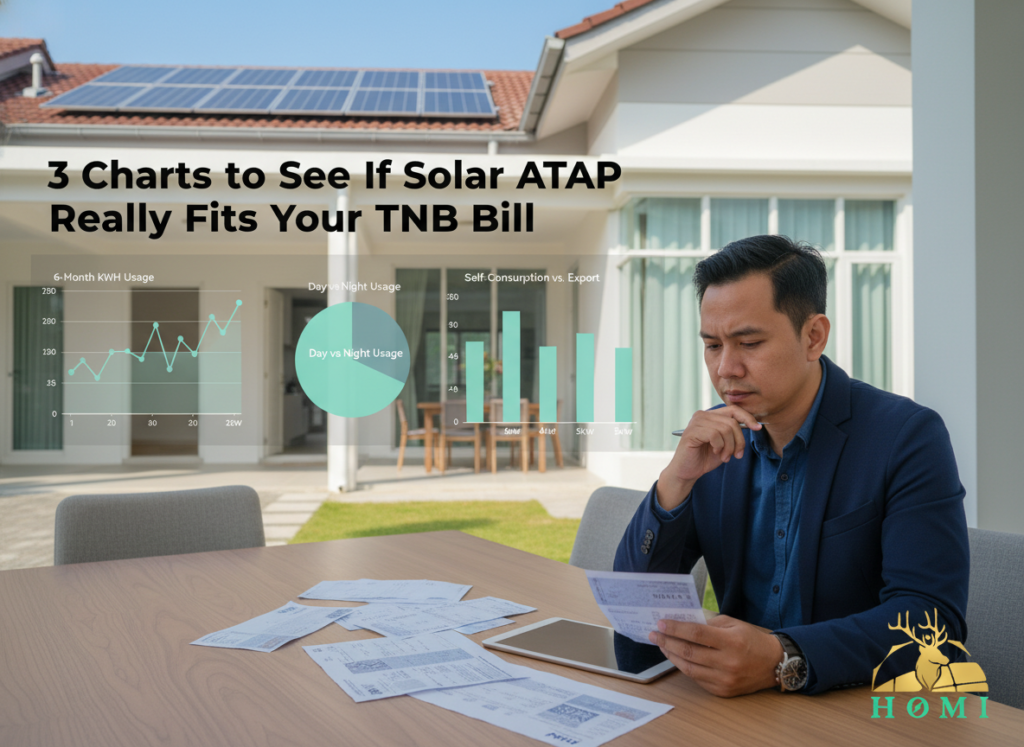
This article introduces three charts that HOMI uses in our sizing reports. Once you understand them, you will know whether Solar ATAP is a good fit and which capacity range makes sense for you.
Chart 1: Your Last 6 Months of TNB Usage
The first chart is simply your **last 6 (or 12) months of kWh usage** from your TNB bills. [web:62][web:259]
- Take the kWh figure from each bill (usually labelled “kWj used”). [web:124]
- Plot month vs kWh as a simple bar or line chart.
- Is your usage stable (e.g. 500–600 kWh every month), or very seasonal (300 kWh some months, 900 kWh others)? [web:248]
- Did CNY or recent heatwaves push usage much higher in certain months?
- Are you often in the higher TNB blocks where each kWh is more expensive, so solar has more value? [web:259]
If your usage is very low (e.g. always below 300 kWh), Solar ATAP might still work—but the “sweet spot” system size will be small, and chasing a zero bill usually does not make sense. [web:124][web:259]
Chart 2: Daytime vs Night-Time Usage Split
Solar ATAP rewards **daytime self-consumption**, because that is when your PV is generating. Credits that rely on export are energy‑only and are lost if not used in the same month. [web:33][web:44][web:62]
- List key daytime appliances: air‑cond, fans, WFH laptops, pool pump, etc.
- Estimate how many hours they run between 9am–5pm and their kW rating.
- Roughly calculate daytime kWh vs night‑time kWh.
| Pattern | Example Profile | Solar ATAP Fit |
|---|---|---|
| Strong Daytime Usage | Retirees, WFH, young family at home, 1–2 AC rooms in afternoon. | Excellent: plenty of self‑consumption potential. [web:33][web:206] |
| Evening-Heavy Usage | Everyone out 9–6, most AC and cooking at night. | Needs careful sizing; oversizing will export too much at low value. [web:33][web:57] |
| Weekend Peaks | Big usage on weekends/holidays, moderate on weekdays. | Still workable; HOMI will size to your typical patterns, not just roof size. [web:33] |
If your Chart 2 shows very small daytime usage and almost everything at night, Solar ATAP is a **maybe** rather than a clear yes—and the system should be smaller than what many “max roof” quotations suggest. [web:33][web:57]
Chart 3: Self-Consumption vs “Wasted” Export for Different kW Sizes
The third chart is the most important under Solar ATAP. It compares, for example, a 3 kW, 4 kW and 5 kW system and shows for each: “What percentage of generation is self‑used, how much offsets energy charges, and how much is potentially unused credit?” [web:33][web:62]
- If I install 3 kW, maybe 80–90% of solar is self‑consumed; export is small. Efficient
- If I install 5 kW, maybe only 50–60% is self‑consumed, and exports may saturate my Energy Charge each month. Risk of wasted credits
Because Solar ATAP credits reset monthly and cannot offset non‑energy components, pushing too high in kW can create a “waste tail” of generation that does not meaningfully reduce your TNB bill. [web:33][web:44][web:204]
- We use your TNB kWh history (Chart 1) and estimated day/night split (Chart 2). [web:206]
- We apply Malaysian yield benchmarks (1 kWp ≈ 4–5 kWh/day) to simulate 2–3 system sizes. [web:206][web:230]
- We overlay Solar ATAP rules: self‑consumption first, energy‑only credits, no rollover. [web:33][web:44][web:62]
Interactive: Quick Solar ATAP Feasibility Check
Solar ATAP Feasibility Snapshot (For Homeowners)
Use this to get a quick sense of whether Solar ATAP is likely a good fit—and a rough “just right” kW range.
This tool uses 4.5 kWh/day per kWp and simple thresholds. HOMI’s full report uses half‑hourly simulations where available and more conservative assumptions. [web:206][web:230][web:33]
Why “Just Right” Beats “Maxed Out” Under Solar ATAP
Under NEM 3.0, big systems could store value via long‑life credits; Solar ATAP removed that safety net. Credits offset energy charges only and are erased each month if unused. [web:33][web:44][web:57]
- If Chart 3 shows that a 4 kW system already offsets most of your Energy Charge, jumping to 6 kW may not reduce your bill much further. [web:33]
- Extra kW then mostly becomes “export noise” with weak financial value.
That is why HOMI’s advice to “comparison shoppers” is simple: if a quotation only talks about “maximum kW we can fit” but not about your Chart 1–3 story, you are not getting a serious Solar ATAP design.
How HOMI Turns Your TNB Bills into a Proper Sizing & Savings Report
When you send HOMI your TNB bills (PDF or clear photos), we generate a customised report built around these three charts.
- Chart 1: 6–12 month kWh trend, with hot-season highlights.
- Chart 2: Estimated day vs night usage, including weekend/holiday peaks. [web:206][web:248]
- Chart 3: Self‑consumption vs export vs potential credit wastage for 2–3 system sizes (e.g. 3.5 kW, 4.5 kW, 5.5 kW). [web:33][web:62]
We then recommend a **capacity range**, not a single magic number, so you can decide based on budget and future plans (EV, more AC, parents moving in, etc.), without stepping into obvious oversizing risk.
FAQ: Charts, TNB Bills & Solar ATAP Feasibility
Do I really need 6–12 months of TNB bills to decide on Solar ATAP?
Three recent bills are enough for a rough estimate, but 6–12 months capture seasonal patterns and festive peaks like CNY. [web:206][web:248] Because Solar ATAP credits don’t roll over, understanding how your usage changes month by month is crucial for choosing the right system size. [web:33]
Why is the daytime vs night-time split so important under Solar ATAP?
Solar ATAP credits are energy‑only and reset every month, so systems deliver the best value when a large fraction of generation is used in real time during the day. [web:33][web:44][web:62] If most of your usage is at night, a smaller system may be more sensible than a “maxed out” design, because exported energy has limited value once the Energy Charge is fully offset.
Can I use TNB’s own solar estimator instead of a custom HOMI report?
TNB’s online solar tools are useful for high‑level estimates and show how bill savings relate to system size. [web:259] HOMI goes deeper for Solar ATAP specifically, modelling self‑consumption vs export and potential credit wastage using your detailed usage profile and updated ATAP guidelines. [web:33][web:62]