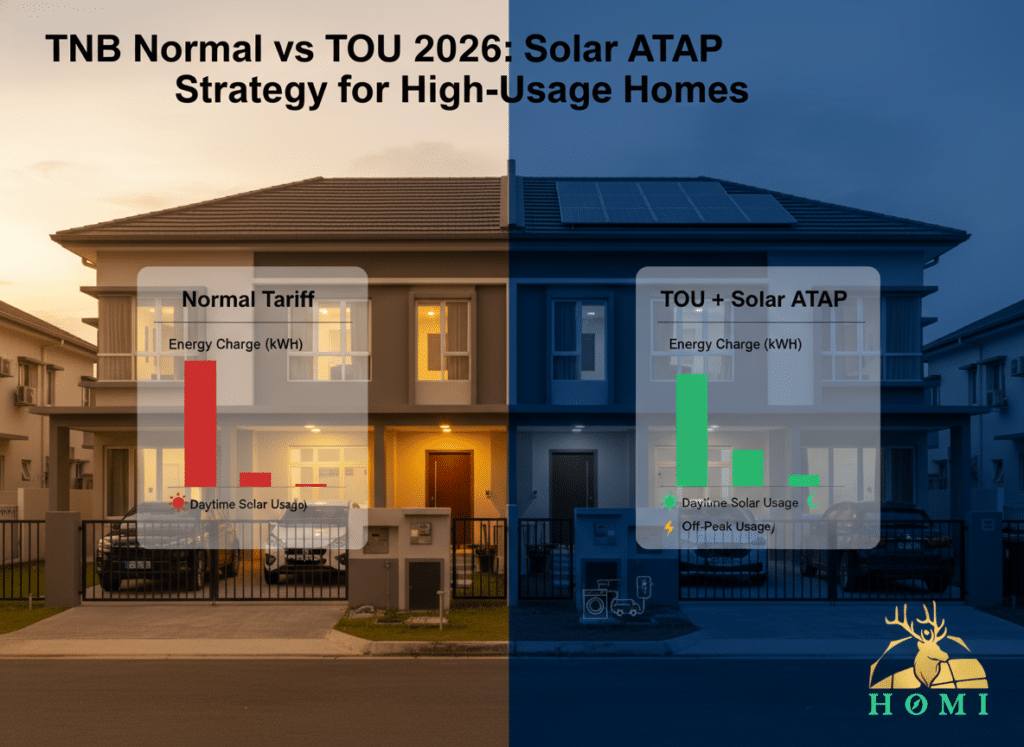
TNB Normal Tariff vs TOU in 2026: How High-Usage Homes Can Combine Solar ATAP and Time-of-Use to Cut Their Monthly Bill
Above 1,500 kWh per month, the Energy Charge under the Normal tariff rises to around 37.03 sen/kWh, while the new Time-of-Use (TOU) option can offer much cheaper off-peak rates for customers who can shift usage to night and early morning.
This article explains, in plain language, how Normal vs TOU works for high-usage homes, how Solar ATAP fits on top, and how HOMI can help you simulate “stay on Normal” versus “switch to TOU + Solar ATAP” using your real TNB bills.
1. Quick Refresher: TNB’s 2026 Domestic Normal Tariff vs TOU
Since July 2025, domestic bills are built from several components, but at the core is the Energy Charge, which now uses a simple two-tier structure.
| Plan | Energy Charge (High-Usage Homes) | Key Idea |
|---|---|---|
| Normal Tariff | 27.03 sen/kWh up to 1,500 kWh/month; 37.03 sen/kWh above 1,500 kWh/month (plus Capacity, Network, Retail charges). | Simple flat Energy Charge for all hours of the day; no price difference between day and night, just usage volume. |
| TOU Tariff (Domestic) | For homes above 1,500 kWh/month: peak around 38.52 sen/kWh, off-peak around 34.43 sen/kWh (Energy Charge), with savings vs Normal concentrated in off-peak hours. | Two time bands: peak (afternoon/evening) and off-peak (night + early day). You pay less for shifting heavy loads to off-peak, but more for peak usage. |
For high-usage homes, the key question is: can you move enough heavy usage (laundry, dishwashing, EV charging, maybe some cooling) into off-peak hours to beat the Normal tariff—especially once Solar ATAP takes care of part of your daytime load?
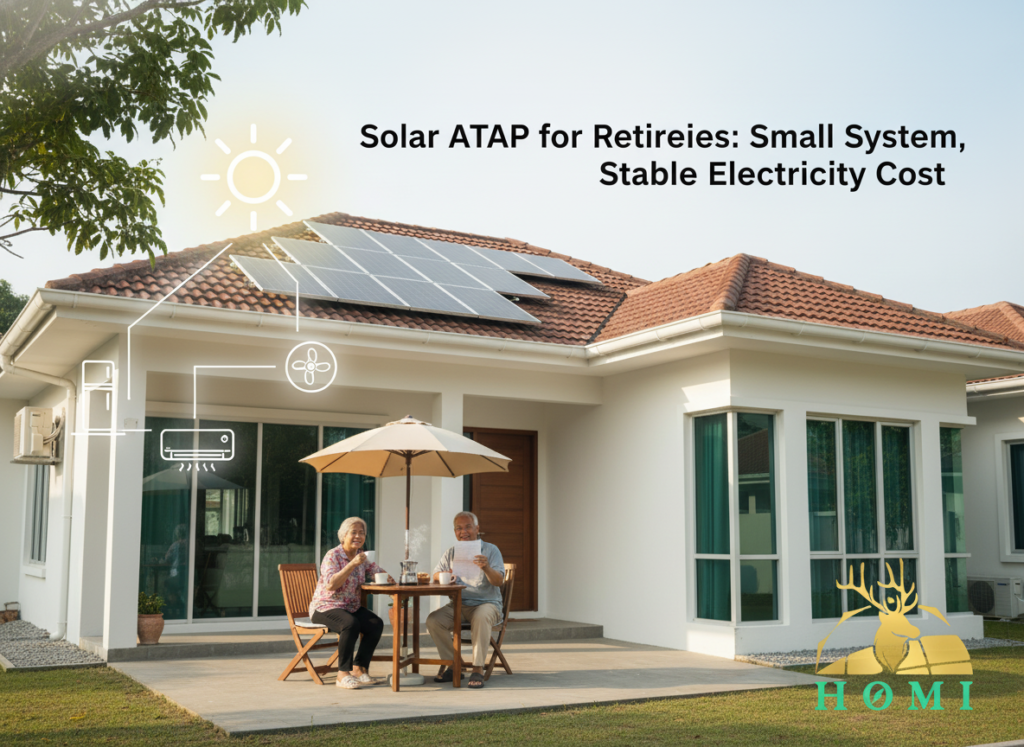
2. Where Solar ATAP Sits in This Picture
Solar ATAP is Malaysia’s new rooftop solar scheme for 2026 and beyond, designed to prioritise self-consumption.
Key characteristics for domestic users:
- You use your own solar generation first in real time, reducing how much kWh you draw from TNB’s grid during the day.
- Any surplus is exported and turned into monthly credits that offset the Energy Charge portion of your bill only.
- Credits reset every billing cycle with no rollover; unused credits simply expire at month end.
This means system sizing and behaviour matter: exporting too much can waste value, while good daytime self-consumption plus smart TOU usage at night can attack your bill from both sides.
3. Strategy: Let Solar ATAP Cover Daytime Basics, Then Use TOU to Shift Night Loads
For homes using more than 1,000 kWh per month, the combined strategy often looks like this:
- Use solar to feed your “always-on” loads—fridges, routers, fans, office equipment, some AC—so grid draw is minimised when the sun is up.
- Aim for a Solar ATAP system size that matches your typical daytime usage to avoid heavy export and credit waste.
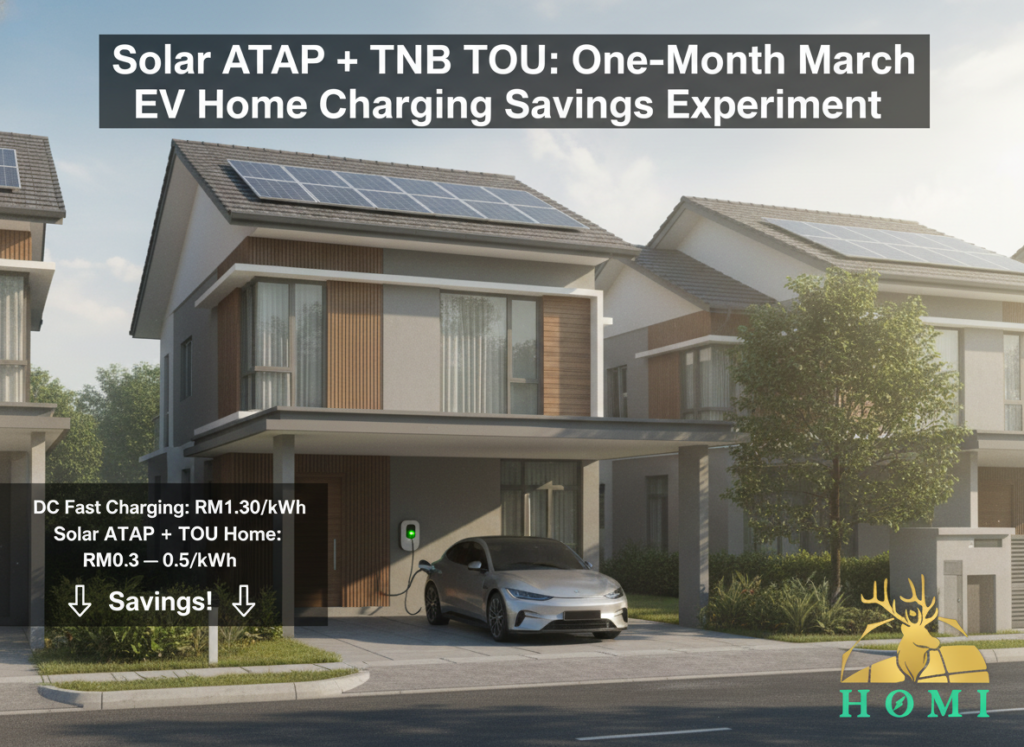
- Schedule heavy, non-urgent loads (washing machine, dryer, dishwasher, EV charging, some water heating) into off-peak hours where possible.
- Minimise AC and other heavy loads during TOU peak hours; use pre-cooling, fans and zoning where reasonable.
In short: let Solar ATAP reduce the Energy Charge you pay for daylight usage, then let TOU reduce the Energy Charge you pay for the night-time kWh that solar cannot touch.
4. Simple Calculator: Normal vs TOU + Solar ATAP for a High-Usage Month
Normal vs TOU + Solar ATAP – Quick Monthly Impact Estimate
Use this simplified calculator to get a feel for whether “Normal + Solar ATAP” or “TOU + Solar ATAP” might work better for your high-usage home. For real decisions, HOMI will model your full bill.
Assumptions: Energy Charge only; Normal = 27.03 sen/kWh for first 1,500 kWh, 37.03 sen/kWh above; TOU (high-usage) = 38.52 sen/kWh peak, 34.43 sen/kWh off-peak; solar output used first to offset daytime Energy Charge; credits beyond Energy Charge are not counted. This is a simplified illustration, not a full bill simulation.
5. Example: 1,600 kWh/Month Home – Why Behaviour Matters More Than Just the Tariff Name
To see how much behaviour matters, imagine two similar high-usage households with a 6 kWp Solar ATAP system and around 1,600 kWh/month usage:
- House A – Normal + Solar ATAP, minimal load shifting: Solar reduces part of the Energy Charge for daytime usage, but big evening loads remain at the Normal rate and some export credits may go unused in quiet months.
- House B – TOU + Solar ATAP, strong load shifting: Solar still covers daytime basics, but most post‑solar usage is moved into off‑peak TOU hours. For the same total kWh, the blended Energy Charge can be significantly lower.
Both houses have the same roof and the same system size—but because House B actively uses TOU hours plus Solar ATAP, their Energy Charge per kWh can be several sen lower, translating into meaningful monthly RM savings.
6. How HOMI Uses Your Actual TNB Bills to Simulate “Normal” vs “TOU + Solar ATAP”
Rather than guessing, HOMI uses your last 3–12 months of TNB data to model both paths side by side.
- Breaking down your historical usage into daytime and night-time patterns using smart meter data where available.
- Estimating Solar ATAP generation for your roof (kWh per kWp per year) and how much of it will be self-consumed vs exported.
- Applying 2026 Normal and TOU Energy Charges and simple behavioural assumptions (e.g. how much you are willing to shift washing, drying, dishwashing, EV charging).
- Showing a month-by-month comparison of “Normal + Solar” vs “TOU + Solar”, highlighting the range of possible savings and the payback impact.
FAQ: TNB Normal vs TOU and Solar ATAP for High-Usage Homes
Is TOU always better than the Normal tariff if I have Solar ATAP?
Not always. TOU can be very attractive for high-usage homes that can shift a large share of their remaining usage into off-peak hours. However, if your lifestyle means heavy air-conditioning and appliance use during TOU peak periods, the higher peak rate may offset the benefit of cheaper off-peak usage. Solar ATAP helps reduce daytime Energy Charge under either tariff, so the real question is how much non-solar usage you can move into off-peak and how your overall kWh profile looks.
How does Solar ATAP interact with TOU rates in practice?
Solar ATAP reduces your Energy Charge by cutting the number of grid kWh you buy during sunny hours, regardless of whether you are on Normal or TOU. Under TOU, solar generation mostly overlaps with daytime hours which may partly include the peak band, so your effective exposure to peak pricing can drop. Off-peak usage at night (after solar hours) still comes from the grid, but at a cheaper Energy Charge if you are on TOU and actively shift loads into those hours.
What does HOMI need from me to run a proper Normal vs TOU + Solar simulation?
To run a meaningful comparison, HOMI usually needs at least three to six months of recent TNB bills, an estimate of your daytime vs night-time usage (or smart meter data if available), basic information about your roof and any large loads you might be willing to shift (for example EV, storage water heater, dryer, dishwasher). With this data, HOMI can model how a Solar ATAP system would perform on both tariffs and show the likely bill difference for your actual household profile.