


Solar on rainy days: compare the weather before judging the output

Lower solar output on a rainy day can be normal; the fair comparison is with the sunlight available to the same system during the same period. Check complete generation records and weather timing before deciding that the panels are underperforming. A rainy-day total compared with a favourite sunny-day screenshot cannot separate weather from a technical problem.
For a Malaysian home or business, this distinction is useful after an unsettled week: it helps you decide whether to gather better evidence, continue observing a plausible weather effect, or request a technical review.
A rain icon is not a solar-resource measurement
Clouds affect the light reaching a roof, but a shower after most daytime generation has finished is different from thick cloud around the middle of the day. Rainfall alone cannot tell you how much useful sunlight the array received. The US Department of Energy explains direct and diffuse radiation; scattered light remains part of the solar resource.
Local context matters too. METMalaysia’s climate overview describes regional and seasonal differences in rainfall, and the effect of cloud cover on sunshine. It is climate background, not a forecast for your roof today. Record the location and timing of weather observations instead of applying one “rainy Malaysia” reduction to every installation.
Compare energy with energy, over matching periods
Start with the system’s AC generation in kWh for a completed day. Do not substitute the electricity exported to the grid: changing household or business consumption can change exports without the same change in generation. Keep the same measurement point and check that the app has finished receiving its data.
For the solar resource, instantaneous irradiance is expressed in W/m², while irradiation over a period can be expressed in kWh/m². A daily energy total needs the matching daily solar total, preferably for the plane of the panels. The JRC documentation distinguishes solar data on horizontal and inclined surfaces. Record which one you have rather than treating them as interchangeable.
Use the same start and end time, time zone and data completeness for both records. A missing afternoon, a delayed upload or a shifted timestamp can create a misleading comparison before any physical fault is involved. Ask what the monitoring platform does with missing intervals.
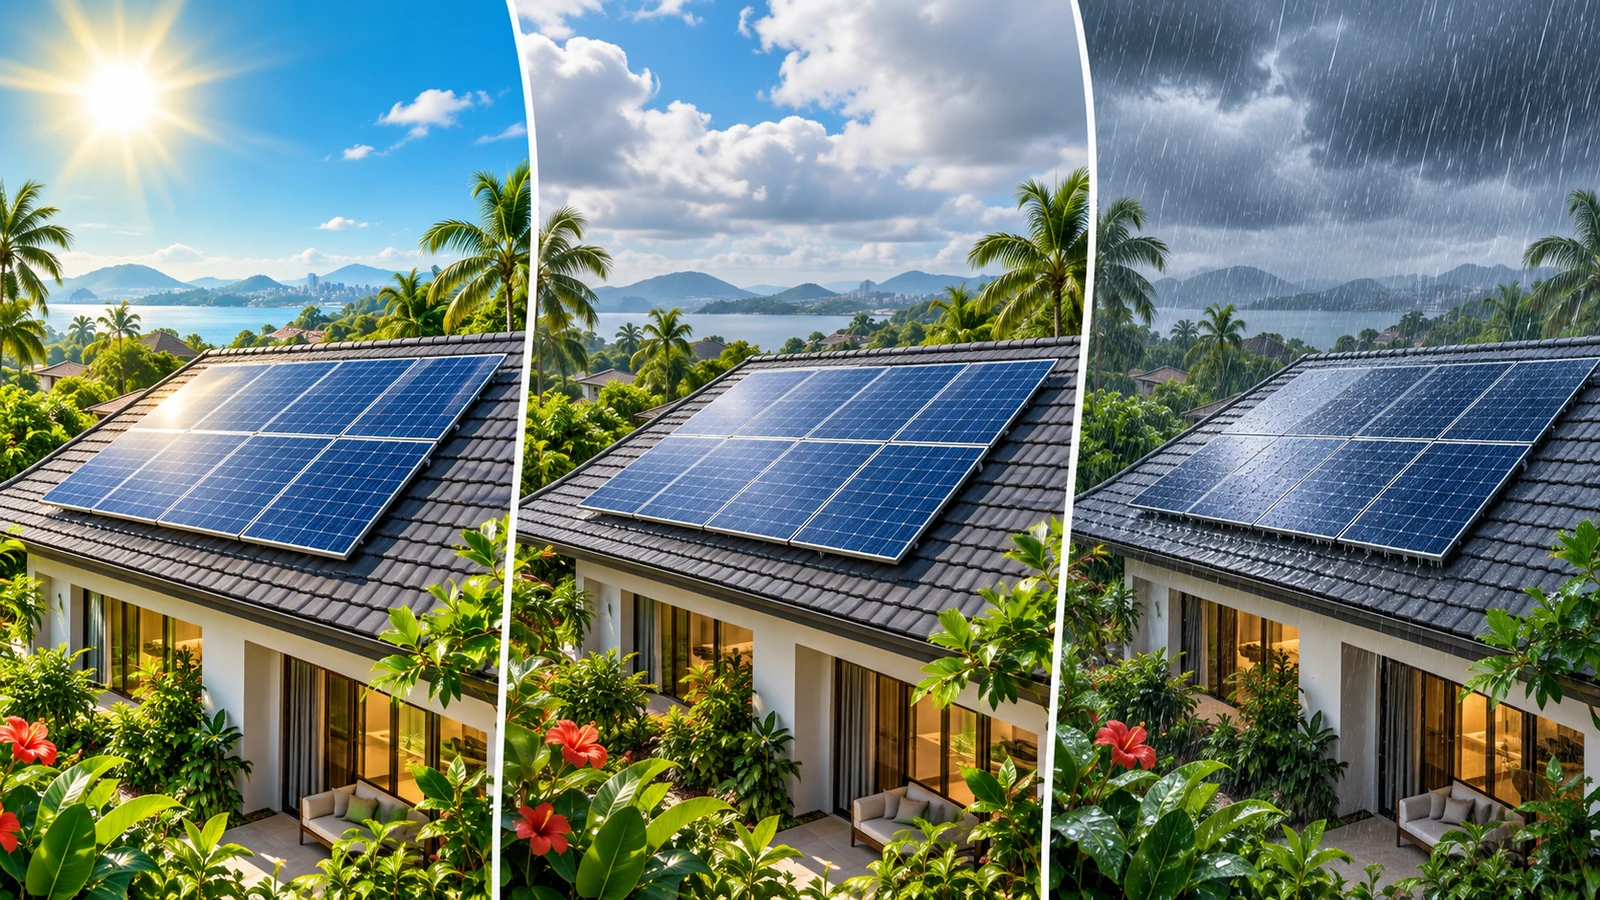
A worked example: less energy can still be consistent
The following days, weather inputs and outputs are entirely hypothetical. Assume a 6 kWp array and complete records. Divide AC energy by capacity to obtain daily specific yield. Then compare that yield with the sunlight received by the panels.
| Teaching case | Panel-plane irradiation (kWh/m²) | AC energy (kWh) | Daily yield (kWh/kWp) | Simplified PR |
|---|---|---|---|---|
| A: brighter day | 5.0 | 24.0 | 4.00 | 0.80 |
| B: cloudier, rainy day | 2.5 | 12.0 | 2.00 | 0.80 |
| C: same assumed solar input as B; investigate the difference | 2.5 | 7.5 | 1.25 | 0.50 |
Source: original teaching inputs and arithmetic, using the uncorrected performance-ratio definition discussed in NREL’s technical report. PR = AC energy ÷ [rated capacity × irradiation ÷ reference irradiance]. Reference irradiance is 1 kW/m². Thus A: 24 ÷ (6 × 5 ÷ 1) = 0.80; B: 12 ÷ (6 × 2.5 ÷ 1) = 0.80; C: 7.5 ÷ (6 × 2.5 ÷ 1) = 0.50. Daily yields are 24 ÷ 6, 12 ÷ 6 and 7.5 ÷ 6.
Cases A and B have different energy totals but the same simplified ratio. Case C creates a question worth checking; it does not prove a faulty panel. This example deliberately simplifies other conditions. The ratios are neither panel conversion efficiencies nor universal acceptance thresholds.
Why the weather correction is not finished
The uncorrected performance ratio still responds to weather. NREL’s weather-corrected PR report explains why temperature can bias a comparison. JRC’s modelling methods also account for module temperature and irradiance effects. Real days do not hold every other influence constant as a classroom table can.
Cooling does not justify promising that rain will increase total production. The Department of Energy’s efficiency guidance explains temperature effects, but those must be considered alongside the changed sunlight. A sound review also checks shading, output limits and whether the system was available throughout the comparison.
Turn a suspicious pattern into a useful service request
If the drop broadly follows reduced sunlight and output recovers under comparable conditions, weather is a plausible explanation. If a shortfall persists after data and weather are accounted for, or coincides with an alarm, ask for review. These are triage clues, not a remote diagnosis.
Send the dates, complete daily totals, generation curves, any alarm messages and the source of the weather information. Label missing information honestly. Do not present historical monthly averages as the actual weather during the event: JRC’s historical datasets have specified time coverage.
If there are signs of damage or water ingress, avoid touching electrical equipment or climbing onto a wet roof. Contact the installer for safe assessment. To discuss a generation concern, use HOMI’s contact page with the records, or explore HOMI’s solar and energy-management services.
Questions about rainy-day output
Should solar production be zero whenever it rains?
No. Clouds can leave diffuse sunlight available, although generation depends on how much light reaches the panels and whether the system is operating. A rain symbol does not predict a fixed output. Investigate unexplained zero readings alongside timestamps, alarms and the actual daylight conditions.
Can rainfall in millimetres tell me the expected kWh?
Not on its own. Rainfall records water, while a production assessment needs the sunlight received by the array over the same interval. Use rainfall to describe the day, not as a substitute for solar irradiation data.
Is the example’s 0.80 ratio a target for my system?
No. It is chosen for the teaching example and is not panel efficiency or a universal pass mark. Real performance interpretation depends on the equipment, temperature, layout, operating limits and quality of the energy and solar-resource data.
What if I have no reliable irradiation data?
Keep the comparison qualitative. Check complete generation records, local weather timing and comparable past conditions, then ask the installer for a suitable weather-informed review. Do not invent a correction percentage or diagnose a fault from a cloudy-day screenshot alone.
Sources and verification
Sources checked on 8 October 2026. The table contains invented teaching data, not a weather forecast or measurements from a HOMI installation.
- METMalaysia — Malaysia’s Climate
- US Department of Energy — Solar Radiation Basics
- European Commission JRC — PVGIS 5 user manual
- NREL — Weather-Corrected Performance Ratio, NREL/TP-5200-57991 (2013)
- European Commission JRC — Data sources and calculation methods
- US Department of Energy — Solar Photovoltaic Performance and Efficiency Basics
This article reflects official information checked on 8 October 2026 and is general guidance. Programme rules, tariff treatment, approval and actual savings remain subject to the latest PETRA, SEDA, Energy Commission and TNB requirements plus the property bill, roof and usage pattern.
Want HOMI to review your TNB bill?
Send your usage pattern and HOMI can estimate whether Solar ATAP makes sense for your home or business.
Discuss My Solar Plan