


Solar DC/AC ratio and inverter clipping in Malaysia: what the production curve means
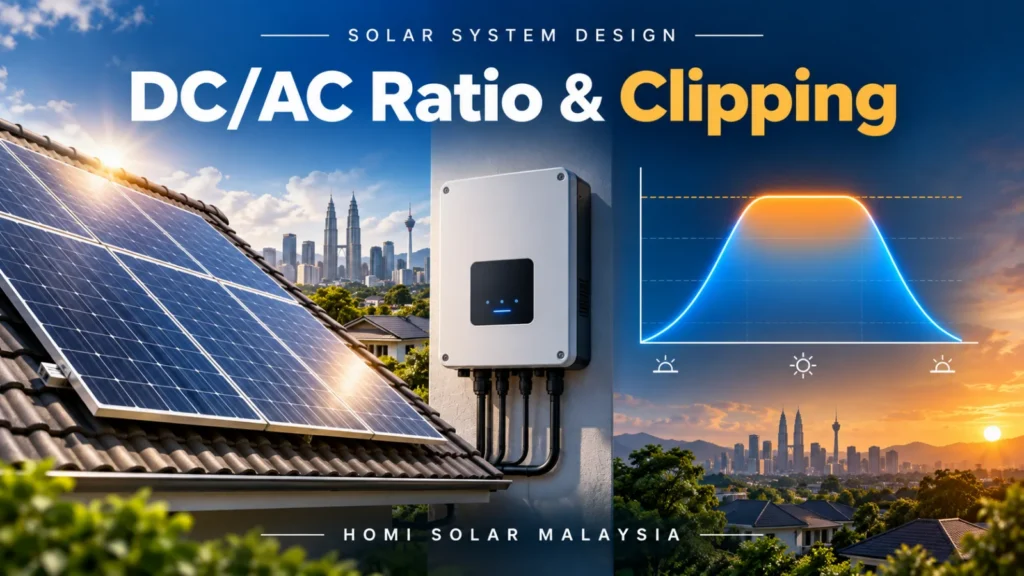
A solar array can have a higher DC nameplate capacity than the inverter’s AC output rating without automatically being wrongly designed. The relationship is called the DC-to-AC ratio, sometimes the inverter loading ratio. The real question is not whether clipping ever appears, but whether the selected ratio, equipment limits and expected hourly production create a sensible whole-system trade-off for the exact roof and load.
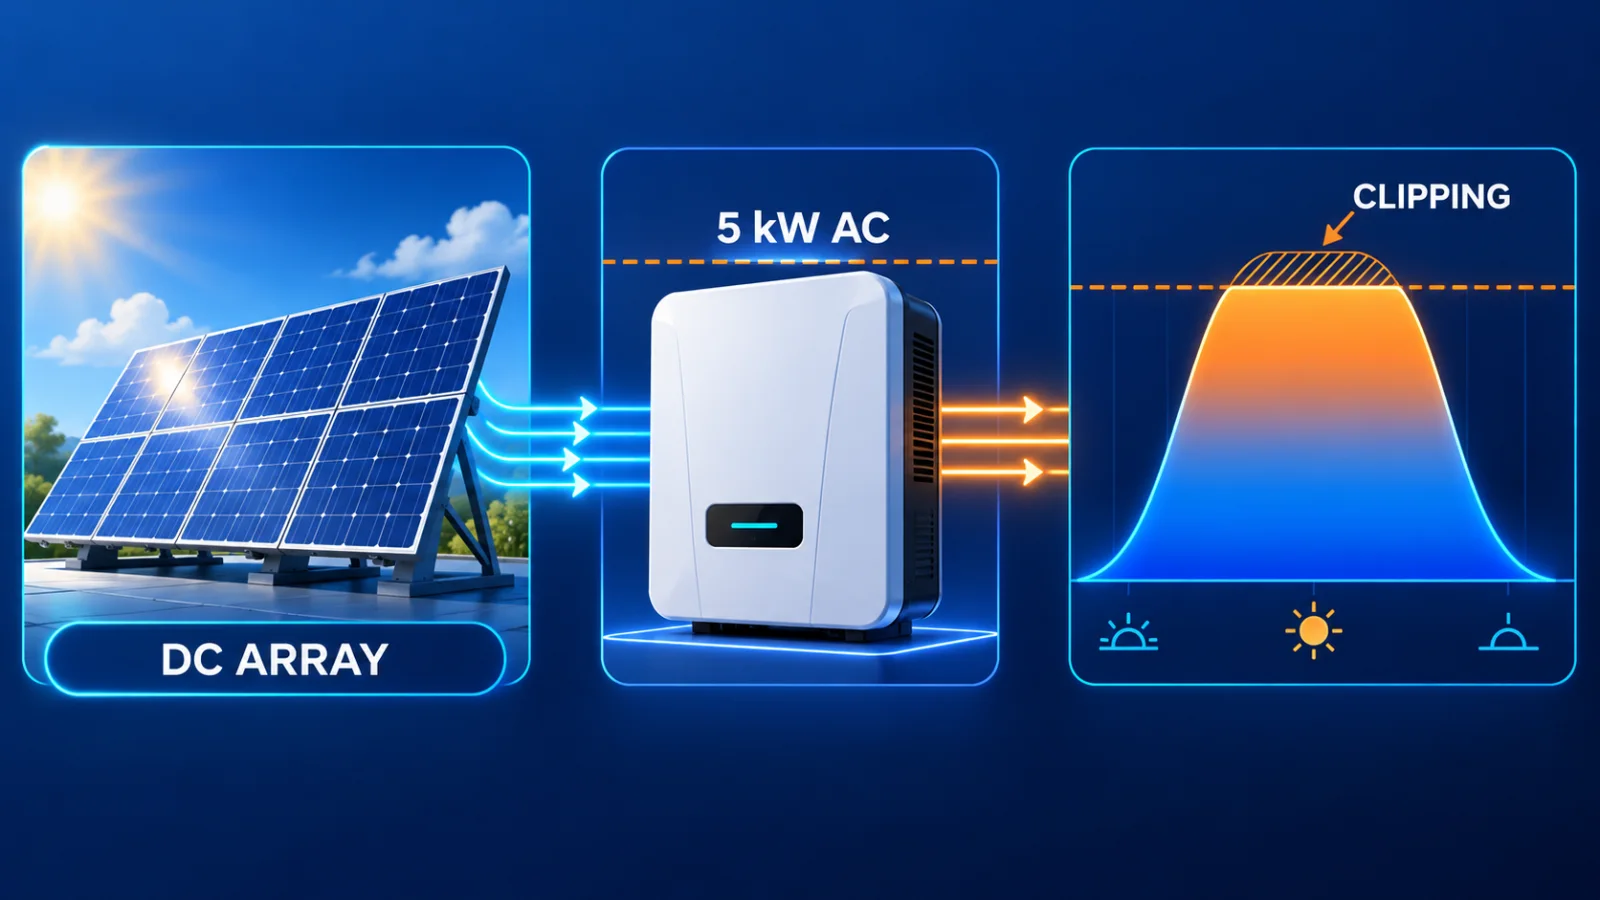
NREL’s PVWatts documentation explains that a larger DC array may collect more useful energy during lower-irradiance hours, while the inverter caps output when available power reaches its AC limit. PVWatts uses 1.1 as a model default, but that is not a universal optimum, Malaysian regulation or recommendation for your site. A professional comparison must simulate the actual climate, orientation, shading, module temperature, wiring, inverter inputs, export arrangement and load.
What the ratio actually compares
Divide the array’s DC nameplate capacity in kWp by the inverter’s AC nameplate output in kW. A 6.6 kWp array with a 5.0 kW inverter has a simple ratio of 6.6 ÷ 5.0 = 1.32. That arithmetic alone does not tell you annual clipping, safety, yield or savings. Modules rarely deliver nameplate power continuously, while temperature, irradiance, angle, dirt, mismatch, conversion and control settings all change the curve.
Worked example: one clear day, four moments
Hypothetical illustration only: the figures are deliberately simplified and are not measured HOMI project data, an energy forecast, a tariff calculation or a recommendation. They ignore detailed temperature and conversion modelling so that the clipping concept is visible.
| Illustrative time | Available DC power before detailed losses | 5.0 kW AC ceiling | What the simplified curve shows |
|---|---|---|---|
| 08:00 | 1.8 kW | 5.0 kW | Below the ceiling; no clipping indicated |
| 11:00 | 4.7 kW | 5.0 kW | Below the ceiling; conversion losses still apply |
| 13:00 | 5.6 kW | 5.0 kW | Output cannot exceed the AC ceiling; the top is clipped in this simplified view |
| 15:00 | 3.8 kW | 5.0 kW | Below the ceiling again |
The 13:00 row does not prove that 0.6 kWh is lost over an hour: irradiance changes continuously, DC-to-AC conversion is not one-to-one and the duration matters. Annual clipping must come from a time-series model using the actual array and inverter. The potential benefit of more early- and late-day production must be compared with clipped energy, equipment cost, warranty limits and how much solar the building can use.
Ask for two production curves
A useful proposal comparison keeps the roof, weather and load assumptions constant, then changes only the array and inverter combination. Ask for an hourly or sub-hourly curve for each option, plus a monthly summary. A bar chart of annual kWh alone cannot show how often the inverter touches its ceiling, for how long, or whether the extra DC capacity helps during cloudy, morning or afternoon periods.
Proposal evidence checklist
- Nameplate basis: total module DC kWp, inverter AC kW and the calculated ratio for every option.
- Input compatibility: MPPT voltage range, maximum DC voltage, current per input, string count, temperature correction and manufacturer oversizing limits.
- Time-series result: clipping energy in kWh and as a percentage, with hourly or sub-hourly evidence rather than a generic assumption.
- Model inputs: weather source, orientation, tilt, horizon, shading, soiling, temperature, availability and conversion-loss assumptions.
- Operating controls: export or zero-export settings, curtailment, battery charging and any site demand limit shown separately from inverter clipping.
- Load match: anonymised interval consumption used privately; bills, account numbers and customer records must stay out of public comments and AI tools.
- Commercial comparison: equipment, installation, maintenance and warranty implications—not only additional annual kWh.
Do not confuse three different limits
Inverter clipping is the inverter’s AC output ceiling. Export limitation controls power sent to the grid and can reduce output even when the inverter has headroom. Module or string constraints concern voltage, current and equipment operating windows. They can overlap in a real system but should be modelled and reported separately.
Regional and programme boundary
The Energy Commission source checked on 15 October 2026 is the June 2026 self-consumption guideline for Peninsular Malaysia. Sabah and Sarawak may follow different utility and authority routes. SEDA’s current Solar ATAP page states that the programme began on 1 January 2026; current eligibility, capacity, technical assessment and implementation conditions must be verified for the exact site. Neither source sets one universal DC/AC ratio for every project.
Homi Solar Malaysia can prepare a like-for-like array and inverter comparison before equipment is approved. Review the current solar service route or contact HOMI for a site-specific review. This article is educational and does not guarantee approval, output, savings, return or eligibility.
Frequently asked questions
Does any clipping mean the inverter is too small?
No. Occasional modelled clipping can be part of a deliberate trade-off, but the proposal must quantify its frequency and energy impact and confirm every electrical and manufacturer limit.
Is a 1.1 DC/AC ratio always best?
No. PVWatts uses 1.1 as a default model input, not a universal optimum or Malaysian requirement. Site conditions, equipment, load, export rules and commercial objectives can justify a different result.
Can I estimate clipping from the nameplate ratio alone?
No. The ratio does not include weather, temperature, orientation, shading, losses or time. Use a time-series model and compare its assumptions with the actual equipment.
Is clipping the same as zero-export curtailment?
No. Clipping comes from the inverter AC ceiling, while export control can deliberately reduce generation because of the grid-export setting. Ask the proposal to report them separately.
Official sources checked
- NREL: PVWatts Version 5 Manual
- NREL: PVWatts Version 5 Technical Reference
- Energy Commission Malaysia: Self-Consumption Guidelines, June 2026
- SEDA Malaysia: Solar ATAP
This article reflects official information checked on 15 October 2026 and is general guidance. Programme rules, tariff treatment, approval and actual savings remain subject to the latest PETRA, SEDA, Energy Commission and TNB requirements plus the property bill, roof and usage pattern.
Want HOMI to review your TNB bill?
Send your usage pattern and HOMI can estimate whether Solar ATAP makes sense for your home or business.
Arrange a DC/AC Ratio Review